There are two common ways to make sure your hardware and software works as it should: collecting logs and collecting metrics. I’m using a self-hosted Elasticsearch database to store logs, and I’m using Kibana to visualize it. It’s pretty easy to set up, and it requires little maintenance, but the things aren’t that bright when it comes to collecting and plotting metrics data.
Elastic stack is good at handling logs and there is a reason for that: it’s main purpose is to process text and everything else is a kind of hack. That’s why I use InfluxDB as a metrics solution: it’s focused on time-series data such as metrics events, and it handles it really well. The data can be visualized with a separate tool such as Grafana, and they play well together.
So, InfluxDB + Grafana seems like a good solution for all of my metrics aggregation needs but, it turns out, I won’t need Grafana pretty soon, thanks to InfluxDB v2. The second major release of InfluxDB comes with a nice frontend that can be used to set up all of my metrics using a simple web interface so there is no need to install anything else.
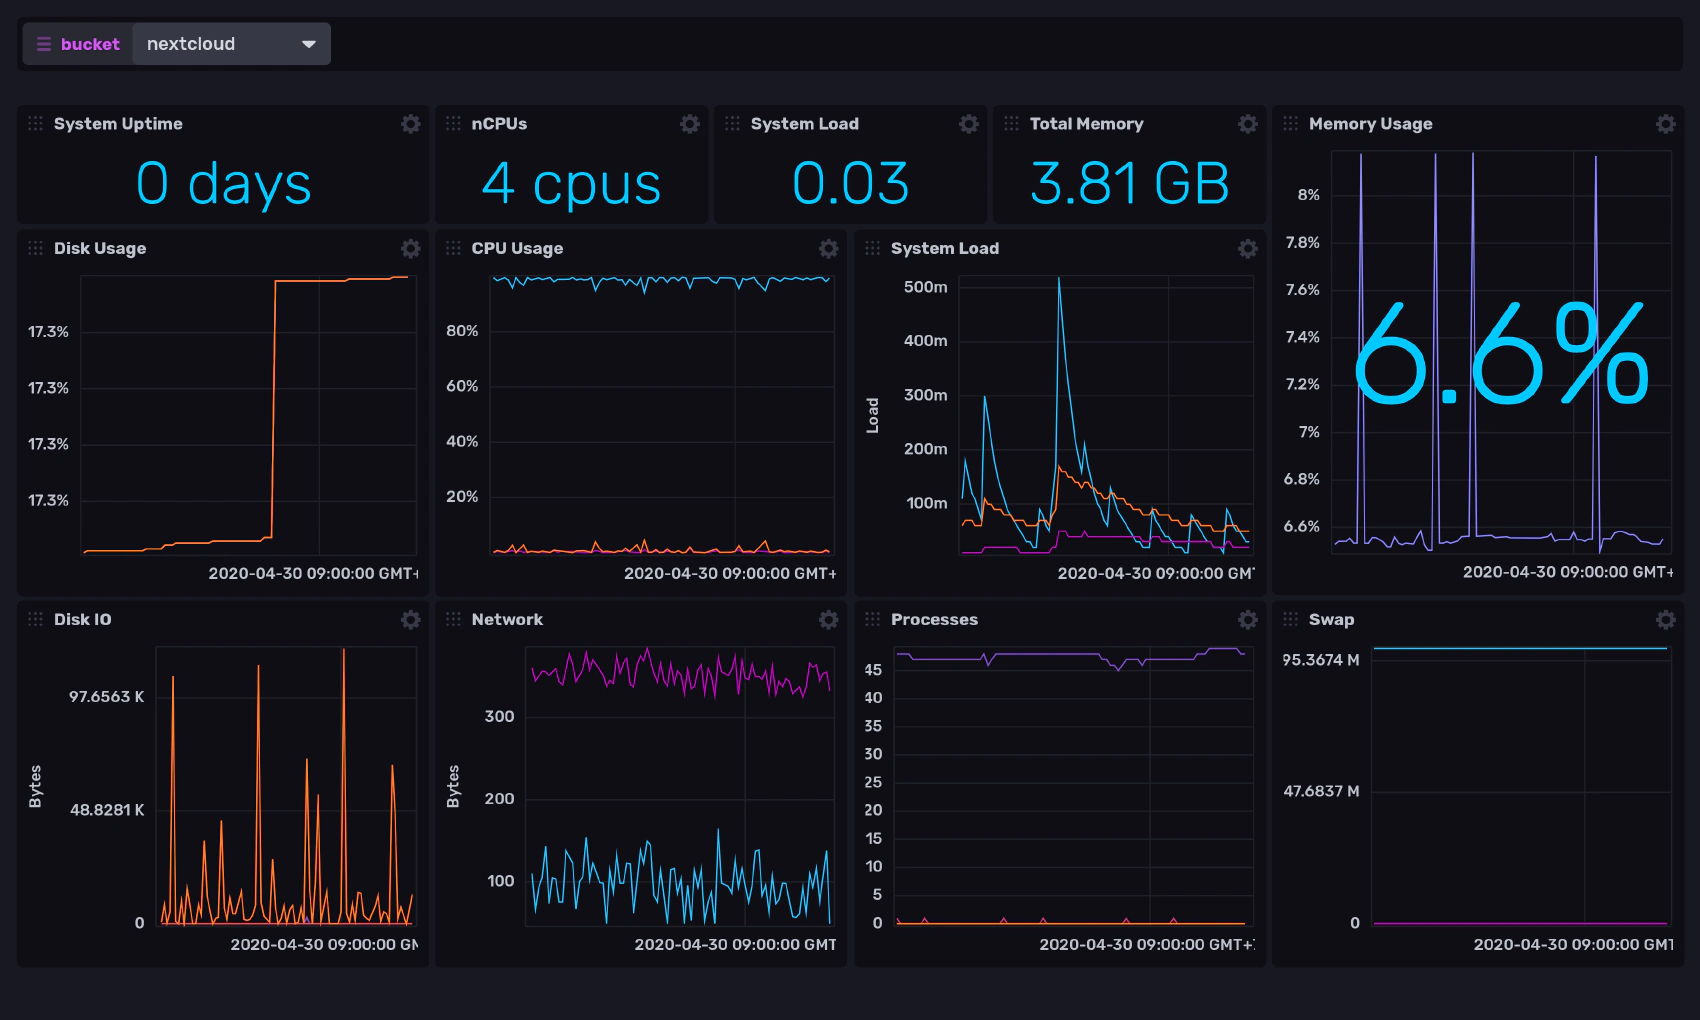
Oh, and it looks pretty cool: