The yield curve is an important thing to watch for if you are trying to understand what’s going to happen with the economy. Yield curve inversion often means we’re about a year from the next recession. Let’s dig a bit deeper in order to understand how it works and what can we do about it.
Table of Contents
What Is Yield Curve?
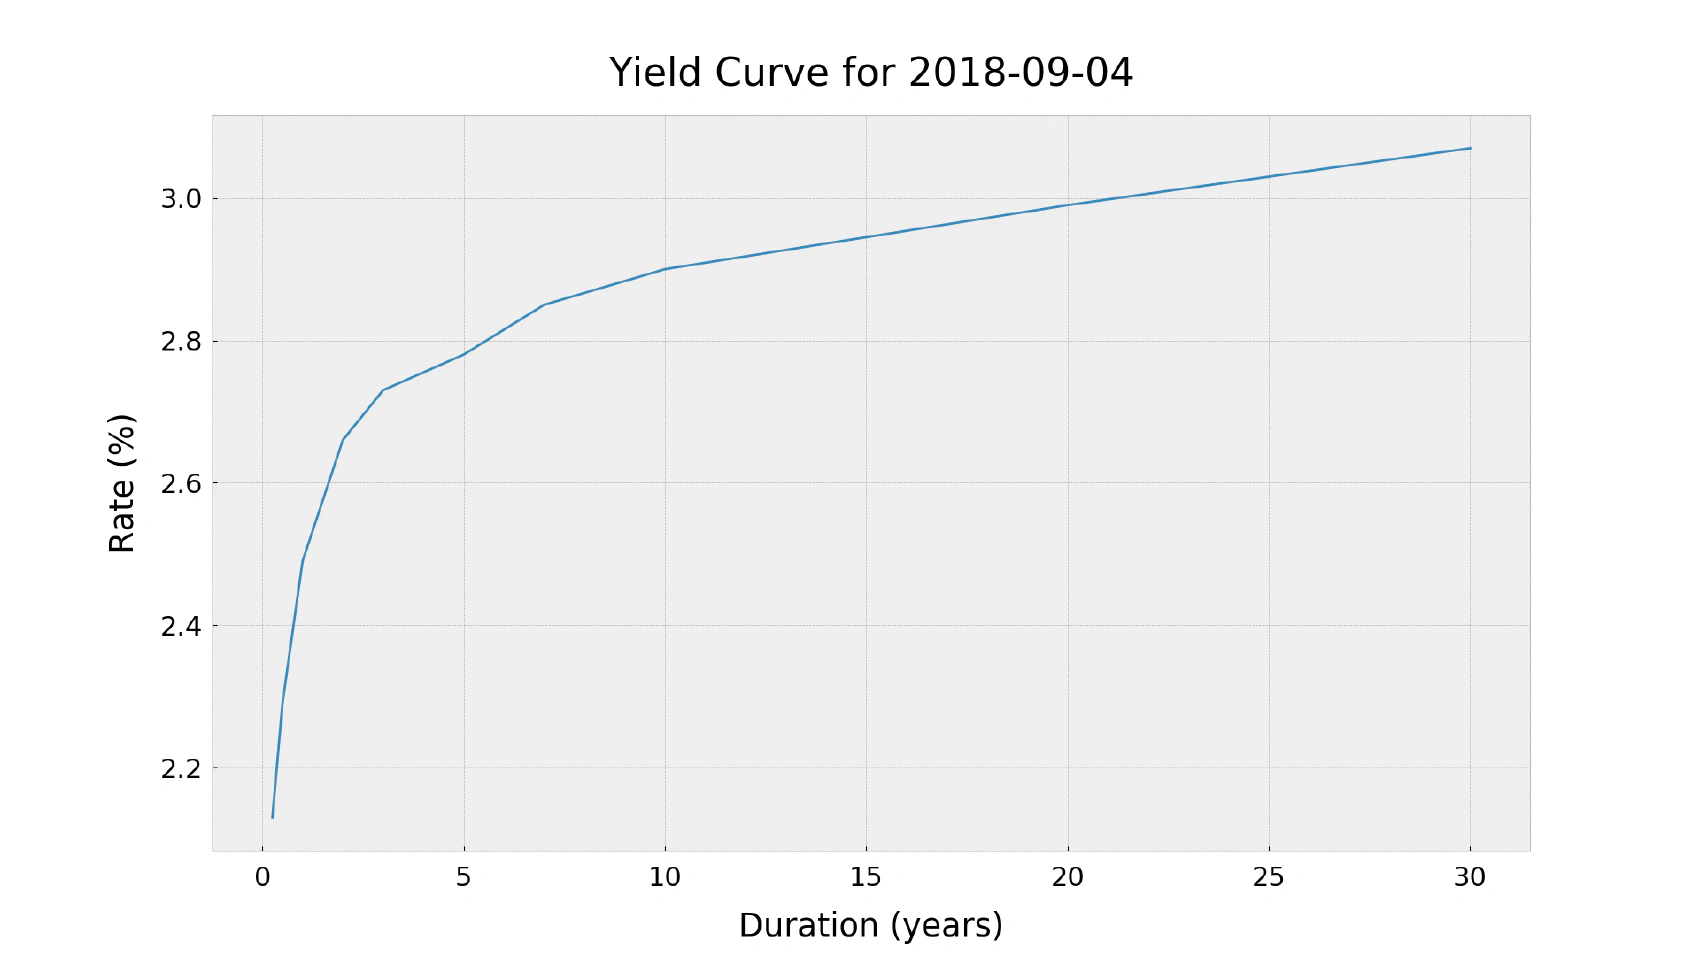
The yield curve shows the relation between the interest rate and the term of the bonds. We’re going to talk about US Treasury bonds only, for simplicity’s sake. The x-axis shows the term and the y-axis shows the return. Here is how the yield curve looks most of the time:
What can it tell us? Nothing interesting, actually. We may conclude that the investors expect higher return for buying the longer term bonds, which is completely rational. There are more things that can go wrong with the economy in the next 30 years than in the next 3 months, so the investors usually want some kind of compensation for taking the extra risk of buying the longer term bonds. There are several alternative explanations that extend or even contradict this model, but the important thing to get from this chart is that it is the “normal” shape of the yield curve. This shape has the same form most of the time, at least since the Great Depression.
What About Now?
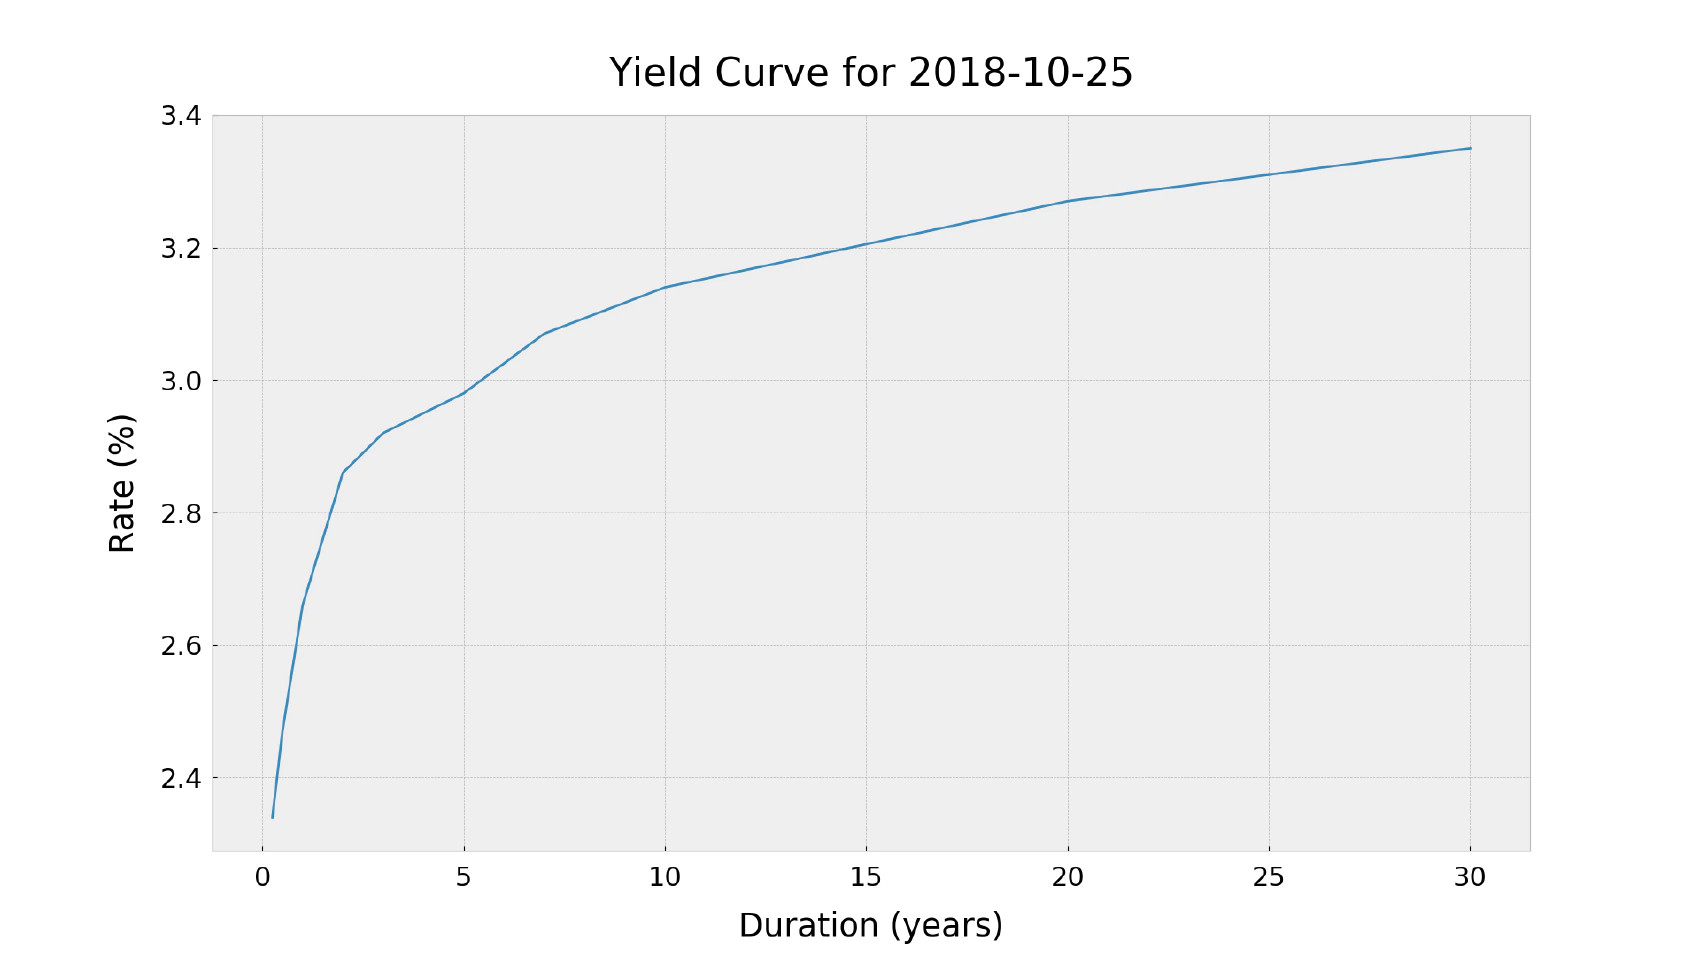
How does the yield curve look now? Not very well, actually. As you may see, it changed its shape, and it has become partly inverted:
So, what’s happening here? The longer term bonds still look normal, but the short term bond yields look like a mess. In other words, it means that, for certain terms, the investors are willing to pay more to get less. You can get 2.49% return on 1 month bonds, but you can only get 2.44% return on 10 year bonds!
What Moves The Yield Curve?
Every segment of the yield curve can be affected by supply and demand so, if more people suddenly decide to buy bonds with a specific term, the yield on that term will decrease. An increase in demand also increases the current price, which automatically decreases the future yield for any bond with the same term.
So the current yield curve actually tells us that the demand for medium term bonds (3, 5, and 10 years to maturity) have increased significantly despite their decreased profitability compared to the shorter term bonds. To make an analogy with retail banking: why would anyone reject a 1-year deposit with a higher return and buy a 5-year deposit with a lower return? It would be more wise to reopen a 1-year deposit 5 years in a row, but only if the deposit rate would stay the same and this is the core of the problem with the current state of the yield curve. It seems like the market expects the rates to go down in the next few years, and the investors just want to “lock-in” the current rates for the next few years or so by buying more medium term bonds.
OK, but what does this have to do with the recession? The problem is, the interest rates do not go down when everything is great. Lowered interest rates are a classic response to economic shocks, so the market thinks that we’re going to experience something horrible really soon. Can we rely on this assumption? Not completely, there is nothing “for sure” in the economy, but an inverted yield curve has predicted most of the recessions in the past decades, so it’s a very strong indicator.
What Can We Do About It?
Yield curve inversion is a good reminder that things will not always be better in the near future, sometimes things get much worse. Every recession is full of personal dramas: a lot of people lose their jobs, their debts become unmanageable, their stock market investments lose a lot of value and all of that occurring at the same time is not fun at all. Generally, we should always be prepared for financial difficulties, but now we have one more reason to make sure we will be able to navigate potential hardships without taking too much damage. It makes sense to boost our savings, reduce our debts and think more about what we’re going to do if the future turns out to be worse than we expect in the times of economic growth.
Conclusion
It’s extremely hard to predict future recessions, and I doubt that anyone can do that. All we have is a bunch of indicators such as the yield curve that have done a good job at predicting the past recessions. Of course, past events do not guarantee that it’s going to be the same in the future but as we found out, the yield curves are not a bunch of magic numbers - it’s a good indicator of market sentiment and if investors are preparing for the worst, maybe everyone else should at least make sure that the next recession will not catch them by surprise.
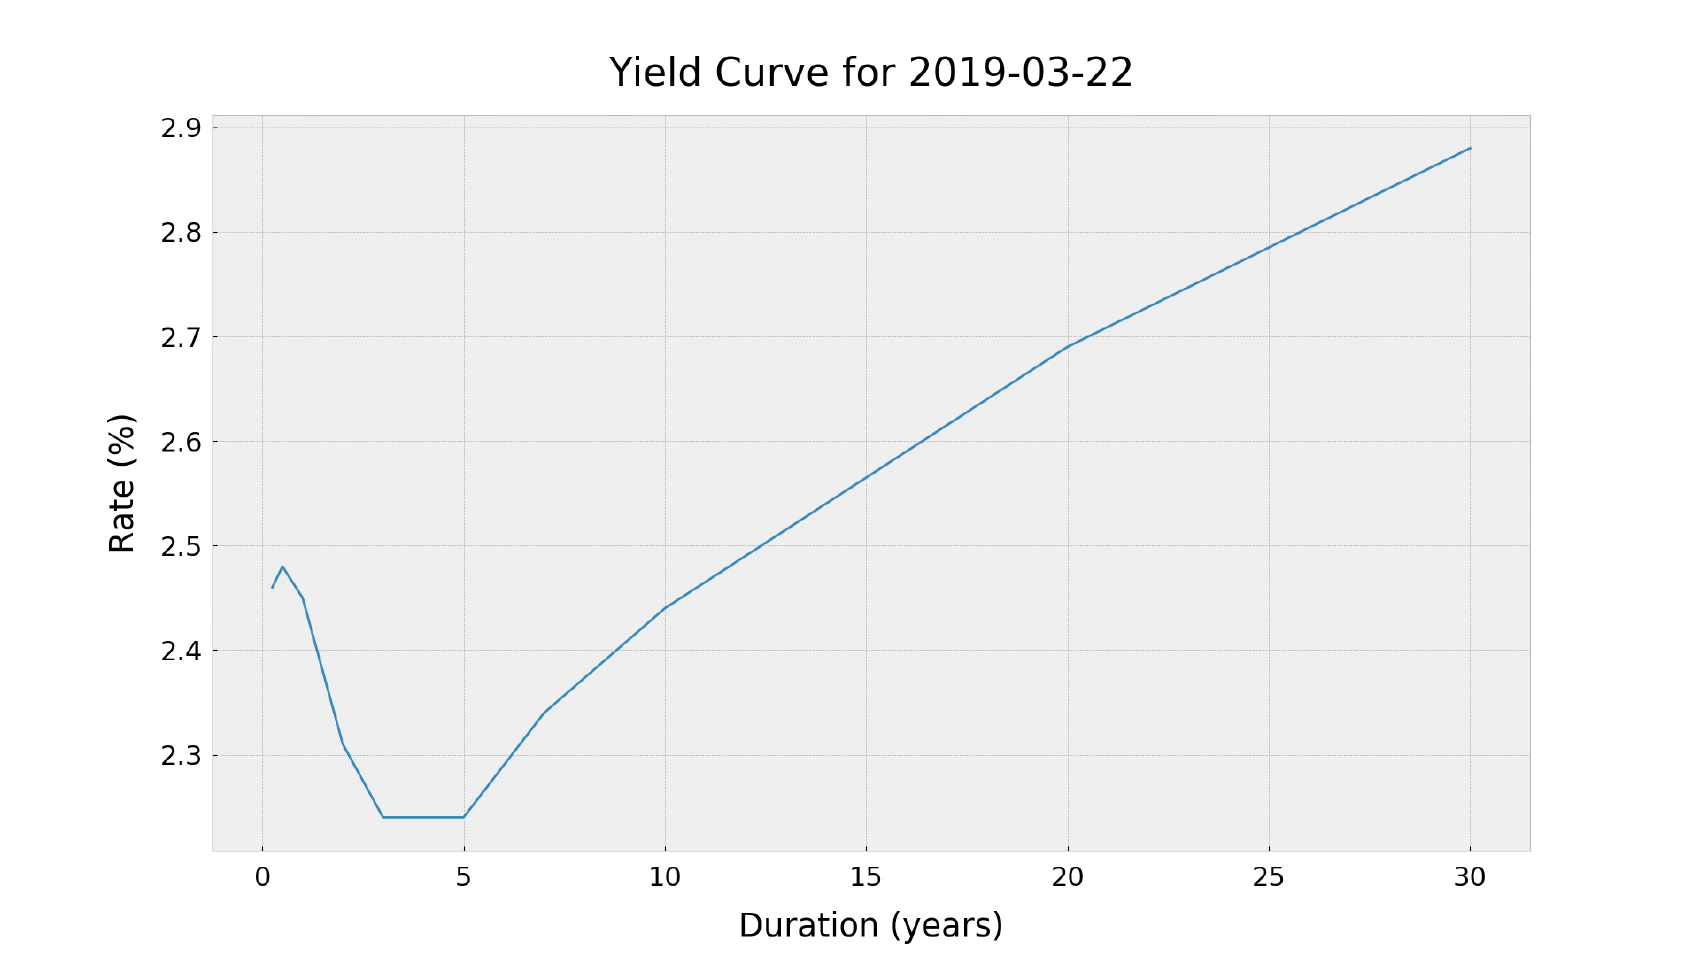
Appendix
Here is how the yield curve evolved since December 2018: